Hiring a consultant is a significant step but the real work begins after they leave. How do you know your investment in diversity and inclusion consulting is actually changing your workplace and helping your business? Are you tracking the right data to measure the impact? This is where the true partnership with a firm like Dimenzion3 proves its worth, we ensure your investment translates into measurable, lasting impact.
Measuring impact moves D&I from a theoretical program to a core business strategy. It tells you what’s working, what’s not, and where to invest next. It directly links culture initiatives to outcomes like retention, innovation, and market share.
Why measuring D&I impact matters for business growth

If you can’t measure it, you can’t manage it. This old business rule applies perfectly to D&I. Clear D&I metrics allow leadership teams to connect culture initiatives with measurable business outcomes. It transforms goodwill into a strategic framework with clear goals. You move from hoping for change to engineering it. This is how you prove ROI to your board and your team. Here are the seven key metrics you must track.
Metric #1— Employee retention and turnover
Monitor voluntary turnover rates by department, tenure and demographic group disaggregated. Why? The steady increase in turnover among certain groups is an indicator of an inclusion issue, rather than a market trend. Effective D&I efforts result in a culture that everyone would like to remain and develop. A reduction in turnover gap is a positive indicator of change.
Metric #2 — Representation across leadership & teams
Representation is a foundational metric. Measure the demographic makeup at every level: entry, management, senior leadership, and board. Look at the rates of internal mobility into leadership roles for different groups. Balanced representation at the top indicates your talent processes are equitable. Stagnation here means barriers still exist.
Metric #3 — Employee engagement & Inclusion scores
Forget about just standard engagement surveys. Implementation of targeted inclusion surveys with items like I feel my voice is heard and I can be my authentic self at work would be great. Breaking down these results by demographic data is a must. A rise in these scores, particularly among the historically underrepresented groups, acts as a proof that your cultural interventions are working.
Metric #4 — Hiring funnel diversity ratios
Examine diversity on every one of your hiring pipelines: applicants, interviews, offers, and acceptances. The fact that some groups of people dropped off during the interview process might be a pointer of the biased interviewing procedures. The future representation pipeline is a healthy and diversified hiring funnel. It demonstrates that your brand of employer and sourcing strategies work.
Metric #5 — Performance & Productivity metrics
Examine whether performance ratings, project assignments, and high-visibility opportunities are equitably distributed. Are some groups consistently underrepresented in “stretch assignment” pools or top performance tiers? Unbiased performance management is a core deliverable of effective D&I consulting. This metric reveals systemic gaps in talent recognition.
Metric #6 — Promotion and pay equity performance
Track promotion rates and compensation across gender and race for employees with similar roles, tenure, and experience. Pay equity is an uncompromised result. Pay equity audits must be done on an annual basis. They rectify the historical imbalances and avoid new ones, creating overwhelming internal trust and reducing the legal risk.
Metric #7 — Customer trust, brand sentiment & market reach
D&I impacts external perception. Monitor brand sentiment analysis, customer diversity data, and market share in new segments. A more inclusive internal culture often leads to better customer insight and innovation. This metric connects internal work to commercial growth.
How to set up a D&I metrics dashboard
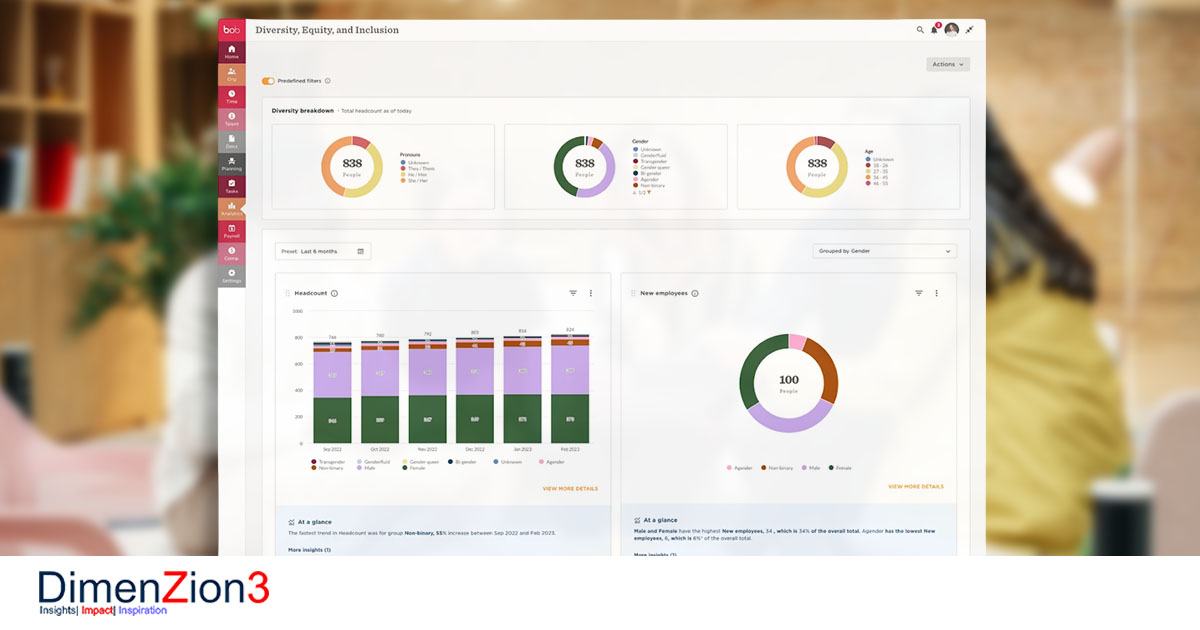
To set up a D&I metrics dashboard, you need to keep it simple and direct.
- Choose 2-3 of these metrics most critical to your initial goals.
- Collect baseline data before any intervention begins.
- A basic dashboard like a shared spreadsheet or slide should be used and are to be updated on a quarterly basis.
- Discuss it during leadership meetings. Regular leadership reviews ensure D&I becomes part of everyday business decisions, not just an HR compliance exercise.
How a D&I Consultant assists in metrics-to-business impact conversion.
A professional consultant, such as ourselves at Dimenzion3, does not simply provide you with figures. We assist you in deciphering the meaning behind the data. We attribute a rise in turnover to certain gaps in training of managers. We associate low scores on the poor inclusion of a department with meeting practices of the department. We give the so what and the what next! and make sure your metrics are action driven towards actionable leadership decisions and structural change.
Conclusion
Investing in Diversity and Inclusion Consulting is smart. Proving its value is smarter. These seven metrics provide the evidence you need. They shift the conversation from cost to investment, from activity to outcome. They show your team you’re serious about building a better, and more successful, business. At Dimenzion3, this data becomes a blueprint for genuine transformation.
Ready to move from measurement to meaningful change? Contact us today.